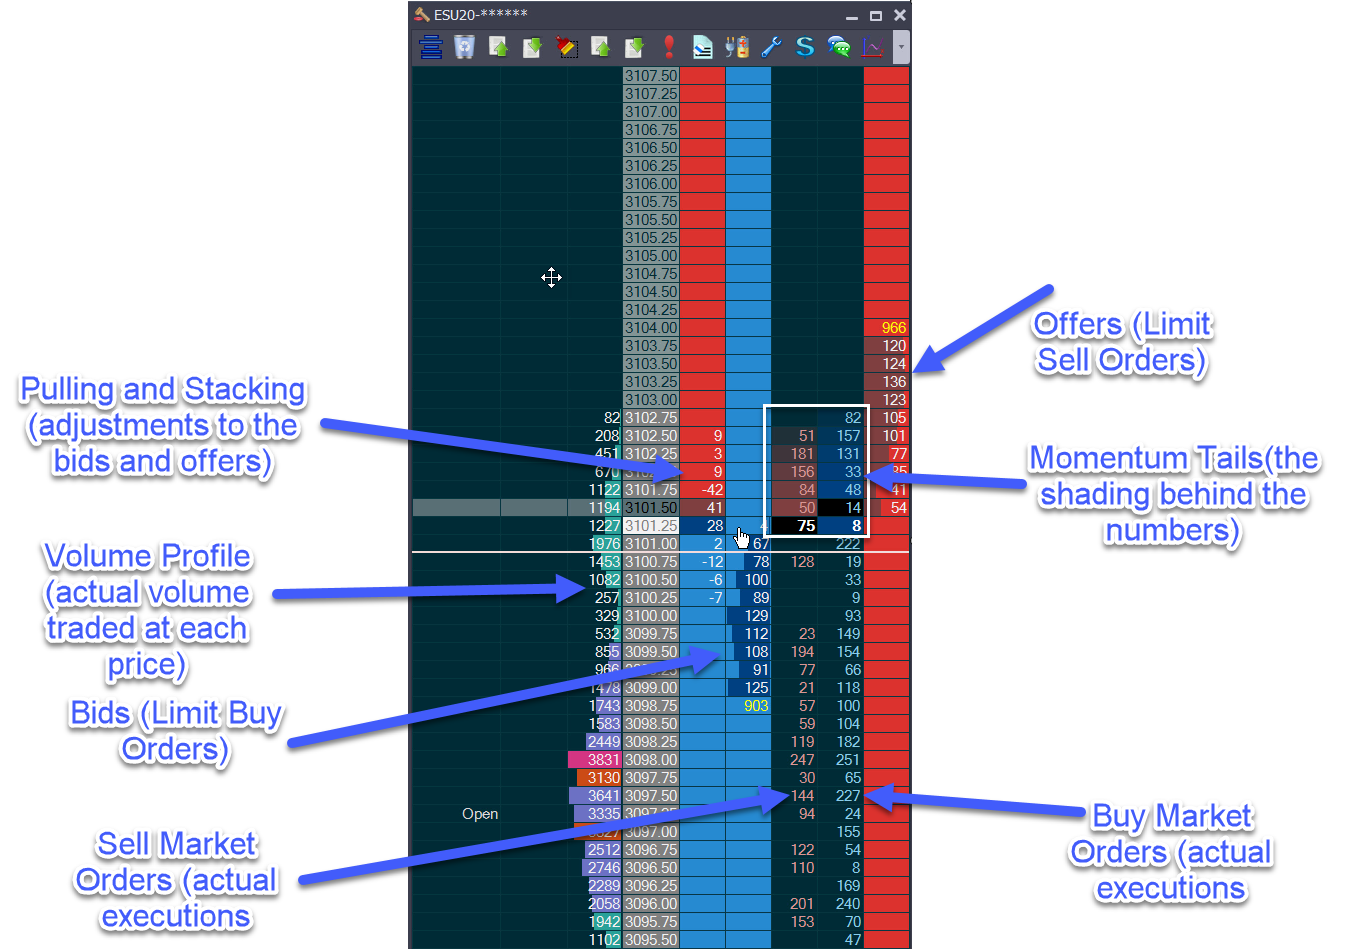
For those that don't know what the DOM is - it's the Depth of Market. Before we proceed, it's important to point out that not all DOM's are equal. Some are too basic to be of any practical use and some freeze up when you need them most - when the markets get really busy.
Here's the Jigsaw DOM and an overview of some of the key features, we'll first walk you through what's on the DOM and then look at how it's used.

Many people look at this and say "there's too many numbers" - but the professional traders that trade off the DOM aren't paying attention to every number. It's more about the flow, how it's moving than the numbers themselves. Some features are just used at certain times - for proprietary trading firms trading Futures, this is where they start their intern traders as they know it's the fastest route to success. We'll see why shortly but first, let's run through the different components.
- Bids & Offers - these are considered "passive orders". Effectively it's orders placed saying - if you come to me I'll buy off you (bids) or sell to you (offers) - but if not, I don't trade. Many of these are market makers and a lot of the bids and offers are fake and move out of the way when price approaches it.
- Buy Market & Sell Market Orders - a trade occurs when a market order hits a limit order. What you see on those central columns is what's trading RIGHT NOW. This is key because it's here you see changes in the behavior between buyers and sellers. But you are looking for obvious changes, like getting to a price and nobody wants to sell any more. Or a price where sellers keep selling but price stops moving.
- Momentum Tails - the shading behind the market orders fades over time, so this gives you a nice visual way to assess momentum. The longer the tail behind the current price, the faster the market is moving through prices.
- Volume Profile - This tells us how much volume traded at each price. Which means it helps you assess where people are positioned and when they are likely to be stopped out.
- Pulling and Stacking - This tells us if buy/sell limit orders are being pulled/cancelled or if people are adding more. This again is a RIGHT NOW thing. You'd only use this to refine your entry, for example, if you wanted to buy but bidders are getting out of the way - you might want to wait - you might still end up buying but at lower prices.
Before we look at what does work - let's consider what doesn't work, as well as the most important thing you need with any trade setup - the "Why". So if you buy something, it's because you think it will go up. You need to know why other traders would buy after you buy. If you have no why, it's likely because you've got the strategy from somebody who doesn't know how to trade and there's a lot of that about. A good example of a "why" is a market moving up, which then turns into a short term range. If you trade a breakout to the upside, the "why" is as follows:
- Short traders in the range getting stopped out will accelerate the market upwards as they buy to unwind their position to prevent additional loss.
- As the market was moving up anyway, traders will see this as a sign of continuation and jump on the momentum.
So here's what doesn't work:
- You can use the DOM on it's own or to refine a chart based trading method, but you cannot put lipstick on a pig. If your chart based trading method doesn't have a "why", then order flow won't help. A good example of not having a "why" would be using something like Fibonacci. I am no expert in Fibonacci but apparently, these are numbers that appear in nature - snail shells, lilies, buttercups and many other things. I haven't once heard an explanation of why traders would suddenly start trading in the other direction because of a Fibonacci level. Yet people use them religiously, without any explanation of WHY trading behavior overall would change when it hit a level. If you believe in Fibonacci - then take a moving average crossover. Same thing - no "why".
- Fading depth. If you see large depth (limit orders) on the sell side when the market is moving up, it does not mean the level will hold. Quite often the depth will simply disappear when price approaches.
- Fading icebergs. An iceberg is where a trader with limit orders hides their size. They may want to buy 5000 contracts but only show 300 limit orders at any one time. As people sell to them, the limit orders increase as people sell but you still only see 300. So you see 300 limit orders, 500 market orders hit the bids but you still see 300.
- The above are both cases of "one rule trading systems". Proprietary trading firms put intern traders through a 12 week program and then it takes 6 months for that trader to earn his live account by getting consistent on SIM. Yet traders at home think they can simply say "if x - go long, if y - go short". I am working with one trader right now that has spent 16 years working through different "one rule trading systems" and getting nowhere.
And here's what does work:
- Trading Momentum. At any random point in time, a market is much more likely to continue what it is doing than to stop and do something completely different. The DOM is the best tool for reading momentum as you can see the actual trading activity as it ebbs and flows. You can also see when momentum is fading. Knowing the cause of the momentum is going to help you decide how to play this. For example, in September 2019, 2 Saudi oil refineries were bombed by drones. The result was momentum to the upside in Crude. If you thought the momentum was just a regular speculation driven trend and didn't know about the news, you would have struggled. Partly because the news caused extreme volatility which means you'd have been better of scaling into a trade also, once in, you'd have known to hold the trade longer. Momentum is often just a short term trend continuing but sometimes it's major re-positioning. Momentum is going with the flow - which is so much easier that the "perma-faders" that are watching markets go up, waiting for a time to sell. Then watching the markets go down, waiting for a time to buy. They fail because they continually trade against momentum.
- Trading breaks of ranges on the Volume Profile. With the volume profile, you can see a range develop much, much earlier than you can on a chart. So you get to trade the extremes of the range on the 2nd and 3rd hits. It takes so long for the range to appear on the chart - you'll be trading the 5th and 7th hits - when it's more likely to break.
- Trading headfakes. A headfake is a false break from a range. What happens is the range breaks - lets use the upside for the example. When it breaks, the shorts buy to close their position. Breakout traders buy to get into position, price moves up but then after a fairly short move (5-6 ticks on the S&P500 is normal), all of the buying is absorbed by an iceberg order on the sell side. That order is placed by the same trader that pushed the market out of the range in the first place. This is easy to see on the DOM but it tends to happen at quieter times because you can't nudge a very busy market out of position.
- Trading Pullbacks. If a market has overall momentum (let's use trends upwards), and the pullback has little participation, it runs out of countertrend traders or a bidder steps up and absorbs the selling, there is a good chance the pullback is over. You can get in at that point or wait for other buyers to come in with size and then go with the trend again.
- Market Making. This is a very different technique looking for higher frequency trades (20-30 an hour is not unusual) and trading the "right now". You could be in a long trade one minute and a short trade the next. The targets are very small but the frequency and win rates are different. You are not looking for big moves. Sometimes you will get filled on a bid, then flip out on the offer, make 1 tick and the market didn't even move. It is NOT compatible with any of the trades above.
With order flow, you can get in with a little confirmation or a lot. You pay for additional confirmation with a slightly worse entry price - which is absolutely fine. There are many, many DOM based setups but it's all about trading them in context. If your market has been in a 15 point range all week with successive inside days, you don't want to be taking directional trades in the middle of that. It's clear the market is undecided.
News is important too - I have a lot of traders say to me "I don't want to trade the news" and I always ask them "So, how will you stop news happening when you trade?". And the answer is obvious - you can't. If momentum suddenly hits the market - and you know it's news driven, you play the move in a different way.
With most trading (not including Market Making), traders are looking for an event that will cause a reaction. They do not care about the win rates. If the event occurs (like traders getting stopped out when a range breaks), you get a fast, directional move which often will continue. If the event doesn't occur, it's a lazy drop back into the range. With these types of setups - you could have a 20% win rate and break even. It's all about cause and effect. And you get to see the cause and the effect play out on the DOM. When the move starts to fade because traders aren't hitting the market as aggressively, then that's the sign to get out.
One other thing professional traders will do is to scale into a position. A win rate of 50% is common amongst elite traders but the amount of ticks in their winners and the amount of contracts in their winners are both higher than their losers.
So the rules are:
- Always understand what's driving the market or if nothing is.
- Look for good risk:reward scenarios.
- Get out when momentum dies.
- When the opportunity is there - scale up the position size.
- Don't worry about being right all the time. Understanding cause and effect will put you in situations where your losers are way smaller than your winners.
And for those of you that love Fibonacci - I do not mean to offend. There are of hundreds of techniques being taught out there that come without explanation or rationale as to why it would have an effect. I had to choose one.

