Volatility can make or break you as a trader. For many traders, it is causing unnecessarily high rates of losing trades. To understand the role of volatility, we’ll take a look at a couple of trading myths that make a lot of sense when you first hear them. As they are myths, they obviously don’t work in practice. Understanding why these 2 myths don’t work in practice, gives us some insights into a key factor of trading success. In fact, taking into account this one factor could absolutely make the difference between your success and failure as a trader.
So, what are these myths?
- If your trading system loses 80% of the time. You can simply change your buys to sells (and sells to buys) and you’ll be winning 80% of the time.
- Entering the market based on the toss of a coin would see you winning 50% of the time
This is just simple math, right? Well, let’s see what happens when we introduce another factor into our analysis. Let’s use an example to illustrate. Let’s consider a trade in AAPL with a 10 cent stop loss. Here’s a look at AAPL from March 2nd, 2022.
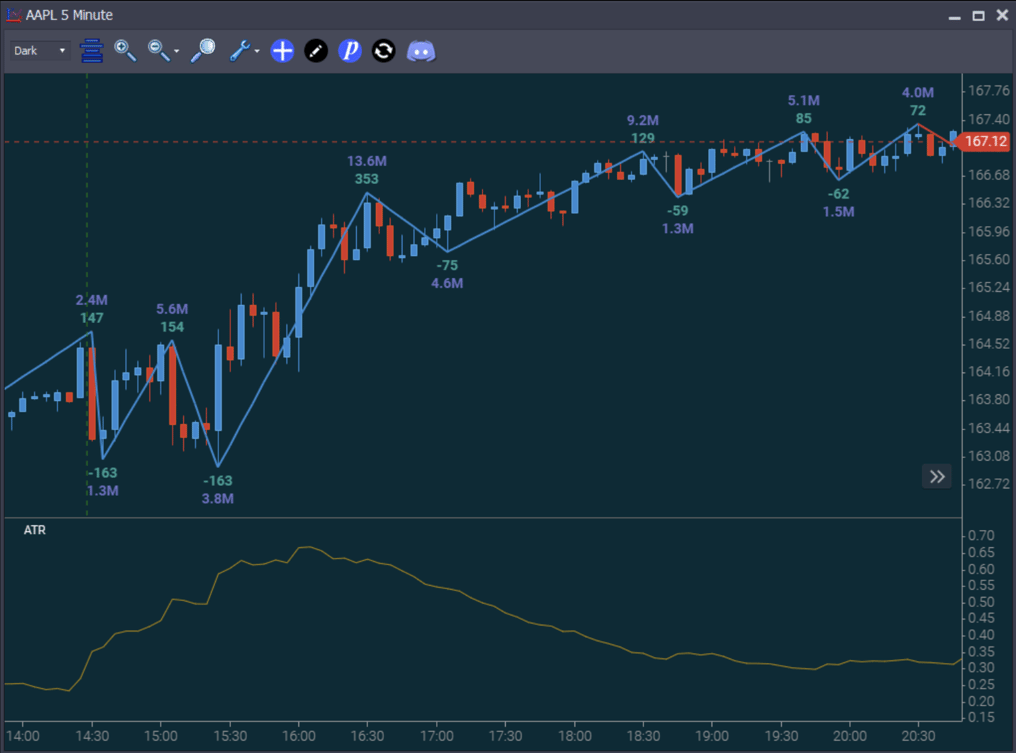
As you can see, the prices are in the top panel and the Average True Range or “ATR” is at the bottom. The ATR, charts volatility changes as the day progress. The 5 minute ATR peaked at 67 cents. In other words, the market was “wiggling” up to 67 cents each 5-minute period.
Back to the myths mentioned above. We could toss a coin so that landing on heads we’d go short and tails we’d go long. In theory, that gives us a 50% likelihood of being right; but there is both the spread and the 10 cent stop to consider.
That 10 cent stop changes the nature of the game from needing to be right… to needing to be “right now”! It’s not enough to just be right about the direction. The winners have to move your way straight away, or you will run out of “wiggle room” and find yourself “stopped out” much of the time. In addition – the spread actually makes your 10 tick stop a 9 tick stop. If you buy at the market, the current bid would be 1 tick below your entry price, so your stop out point would be 9 ticks below the current bid. The bid only has to move down 9 prices to stop you out.
Now, at this point, there will be people reading this that are losing way more than 50% of the time. Maybe you had a day where you took 10 trades and everyone was a loser, and you told yourself, “I could toss a coin and do better”.
It’s annoying, isn’t it? But this brings us to the second myth.
Let’s say you are losing 80% of your trades. You switch your buys to sells and vice versa. If you keep the same approach to having stop losses that are small, relative to the volatility of the day, you will find you still lose 80% of the time. Reversing entries doesn’t help. It’s the volatility that is taking you out, whichever side of the market you trade and whenever you take a trade.
So what’s the solution to this problem?
Well, it helps to keep track of volatility. ATR is a decent measure but it’s not the only one. We’ll stick with it for this article, though. Let’s say the ATR is 67 cents and the market has just moved up 65 cents. At that point, you go long, using a stop of just 10 cents.
As the market has just moved up 65 cents, it’s close to the extreme of the normal 67c “wiggle” in the market. This is not an exact science. The market won’t wiggle the same amount every time. If you go long after a move up of that size, then there is a high probability that the market is about to pull back a little – and stop you out in the process.
Consider the same market moving up overall, and it drops down 70c. Now you take a long trade and this time you use a 67 cent stop. It should be pretty obvious that this time that stop provides a lot of breathing room. The market has already moved one ATR and you are allowing an additional ATR for the trade to work. In other words, you have a wiggle in hand and are allowing for another additional wiggle…
Now, let’s see what we can do with the coin toss. We can take the same coin toss, and it tells us to go long. We’ll add another rule. We don’t have to go long immediately. We will wait till the market moves 67 cents to the downside, and THEN enter the market, this time also allowing for a 67 cents stop. It’s still trading at random, you are not taking into account the overall state of the market, but you’d not be losing more than 50% of the time.
Even though it’s an interesting exercise, none of us are actually looking for 50% trades from a coin toss. But this does establish just how important it is to consider volatility as a factor, to avoid ‘hidden’ risk.
There are 2 adjustments you can make that will help you deal with these high loss rates.
- Be patient. Don’t chase the market. Don’t be in a hurry to be in a trade all the time. Let the market come to you. For example, if the ATR is a dollar, and you want to buy, then go long when it swings down a dollar. If it doesn’t swing down a dollar, don’t take the trade.
- Make volatility one of the key factors in the size of your stop loss. Allow yourself some wiggle room after you enter. If you have a high loss rate now, see what happens when you allow one or even two ATRs as a stop loss. Of course, you can use Order Flow to refine your entries for smaller stops, but that’s for another article.
We often see runaway markets, often in response to major news. Those can run in one direction all day without pulling back at all. They have an Average True Range, but most of the bars are moving up, without much counter-trend wiggling at all. We’ve all sat there watching markets like this, feeling like we are missing out until we finally decide it’s never going to pull back. We must buy or we’ll miss out. So, we buy and find we just got long at the high of the day.
Those kinds of days are rough when you never see a good price for you to enter. On those days, the best approach is to scale in. Take a small position with no pullback. Add to it once the market moves your way. Allow some wiggle room, but use a smaller initial position amount as your protection. If it does move your way, take advantage of the runaway market to increase your position size.
Is Average True Range the Only Measure of Volatility?
ATR is certainly convenient. In this article, we used a 14 bar ATR and the bars were time-based 5 minute bars. At the market open, we’d be looking mostly at bars from the prior day. Liquidity is another way to measure volatility.
What is liquidity? Markets don’t buy and sell. They just match buyers and sellers. Liquidity is basically the availability of the “other side” to trade with. If you want to buy, is there a seller there to sell to you? Volatility is inversely related to liquidity.
Let’s look at two different volatility markets:
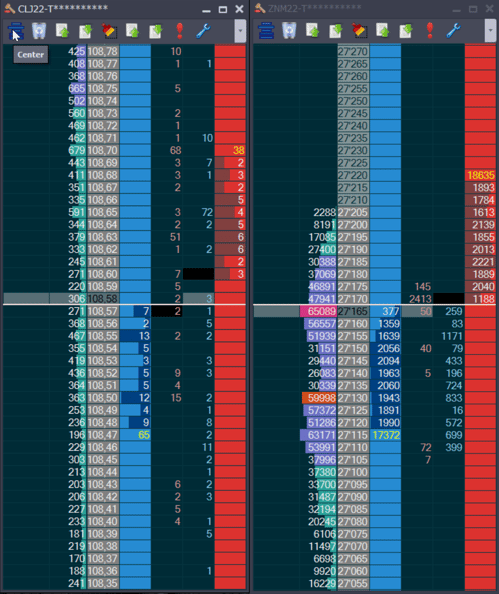
Figure 2 – Crude Oil on the left, US 10-Year Treasury Note on the right
In Figure 2 above, the left side shows Crude Oil averages less than 20 contracts on the blue bid/buy-side. There’s a bit less seen on the red offer/sell-side. The 10-Year Treasury Note on the right has more than 2000 contracts at many levels. On both instruments, the second column from the left is the volume profile, or how many contracts have been traded at each price. It is much higher on the 10-Year T-Note. That’s because it takes a lot more volume and time to move through all that liquidity. There is less wiggle in that market.
Regardless of what you trade, it periodically pays to glance at the liquidity on the DOM/Level 2. Changes are an indication that the volatility is changing. You’ll see that before news announcements, liquidity disappears because market makers stay away. The market starts to move erratically. Take a look at the DOM/Level 2 every 5 minutes to see if liquidity is growing weaker or stronger. That indicates impending volatility changes before they are shown in the Average True Range.
Volatility is not going to be your friend if your stops don’t take into account the amount of wiggle in the market. You also need to be wary when at the extremes of a wiggle because there’s a lot of “mean reversion” trading going on out there. On the other hand, Volatility can benefit you when you understand it. You can begin working at the outer extremes of the wiggle room and enter trades with a lower probability that the market will move against you.