
It’s natural to approach the markets with a “them vs. me” mentality; to see the market as one thing and yourself as another. The reality is that a “me vs. me” scenario is closer to the truth; The markets are better viewed as a collection of people just like yourself all trying to squeeze money out of the markets.
In effect, the markets consist of a mass of participants all trying to guess what the mass of participants will do next.
This could give you a headache just thinking about it.
Of course, not all market activity is speculative. Or rather, not every trade is taken with a view to making a profit on that specific trade in that specific market. A trade might be an airline taking a hedge on fuel prices. Other than a massive correction, they won’t care what happens to prices in the short term and they won’t react to short-term price fluctuations. An arbitrage trade such as a calendar spread or a NOB spread also is non-directional for the individual sides the spread is placed. As long as the spread is widening/narrowing as expected, it doesn’t matter to them if prices are moving up or down.
Some trading is purely speculative. But how much? Well, that depends on the market and it depends on what’s going on that day. There is certainly a lot more speculation in the US Index Futures than the US Corn Futures. In markets like the e-Mini S&P500, the vast majority of trading is speculative. It’s hard to get actual numbers but my personal estimate is that a minimum of 80-90% of the trading on the eMini S&P500 Futures contract is intraday speculation.
Each market will differ in this respect and individual days will differ too. The intraday speculators will be taking a ride with the longer-term traders OR getting run over by them because they weren’t informed enough to realize what was going on.
The Market
Some traders like myself play specific markets. Other traders play specific situations (such as stock earnings reports) across multiple markets. Most retail traders lean towards outright trading where you buy to sell higher later or sell to buy higher later.
Situational trading, such as trading stock earnings reports is a popular way to trade. For me, I feel there is too much work to be done in researching for opportunities before the open. I also feel at a disadvantage to people that trade stocks daily that might appear on my radar just a couple of times per year. I find that I spend so much time looking for opportunities; I’m often there when the opportunity has passed. Other people thrive in this environment.
Specializing in a small number of markets is my preference. The decision on which specific markets to trade then comes down to a number of factors:
Is the Market ‘fair’?
We’d be a bit naïve to think that all participants in a market play it straight but we need to ensure the playing field is as level as possible so that we stand as good a chance as any other speculator. Forex markets are the most fragmented, with exchanges on every street corner. Any individual brokerage can quote any price they like, although arbitrage keeps them in line. Stock markets are fragmented to a lesser degree and some exchanges are intentionally hidden (Dark Pools) but overall there’s more transparency than Forex. Futures markets are traded on a centralized exchange, with all participants able to see the same liquidity and trading activity. This is the most transparent of the markets.
Is it rich in information?
Price information is available for all markets. In addition to price changes, many traders assess changes in volume and liquidity to pre-empt changes in market state. Volume and liquidity information is not available for the Forex markets. For stocks, it is available (at a cost) with the exception of dark pool activity. With Futures, all players can see all of the liquidity, volume, and trades.
Can I Trade sufficient Size?
The volatility in the market and the liquidity are key here. If a market only moves 5 ticks a day but you can trade 10,000 contracts, then maybe a tick is all you need. You cannot expect to trap the entire market range each day, so look for a smaller portion of the range and the amount of size you can trade. You need room to be able to trade now and to scale up. For Forex there is theoretically no limit to the size you can trade. With stocks, it’s down to the individual stock and similarly, for Futures, you have to be careful about which one you pick.
For my style of trading, Futures markets have a clear edge in terms of centralization and visibility. The eMini S&P500 is very liquid and you can scale up. Most of the trading there is speculative and short-term. As a short-term trader, I understand my opponents and I can clearly see what they are doing.
Armed with that, I am confident that in this market (and other futures markets) I can gauge strength and weakness and look for areas where speculators may be caught offside.
The Strategy
Short-term speculators all have their own ideas about where to get in and where to get out. It’s like a shopping mall full of shoppers; all buying in different places. If you mapped out where each shopper in a shopping mall was at any point in time. How would you predict where they would all be in 15 minutes' time? It’d be impossible… unless you set off the fire alarms! Then it’d be fairly predictable. The markets are the same, people are in and out, a directionless herd until there is a trigger that causes a directional move that speculators jump on. Often the trigger is a group of traders being stopped out but the follow-through is the herd seeing clear directional movement. Not only do you then have direction from the herd of new traders perpetuating the move, but you also have the stopped-out traders now thinking twice about trading in the opposite direction.
The perpetuation of a directional move is much easier to predict than the end of a directional move, yet new traders are obsessed with buying the top and the bottom of a move. Buying the low of the day and selling the high of the day. This obsession is what blows people’s accounts.
The trouble is that in some cases, the market is in a range. Then the trade IS to fade the extremes. When the market is in a trend, the trade is to trade with the trend.
So you need to employ the complete opposite strategy for the 2 basic states of the market.
So we start our strategy with 2 simple rules.
1 – Fade Ranges
2 – Take continuation trades of intraday trends
The Tools
In this article, we will focus on using Swing Charts to define areas to trade. In my trading, I put heavy emphasis on using Order Flow to refine the entry. For most people, Order Flow acts as icing on your trading cake. For now, let’s just focus on getting the cake – implementing a profitable trading setup that can be refined later with a little Order Flow icing.
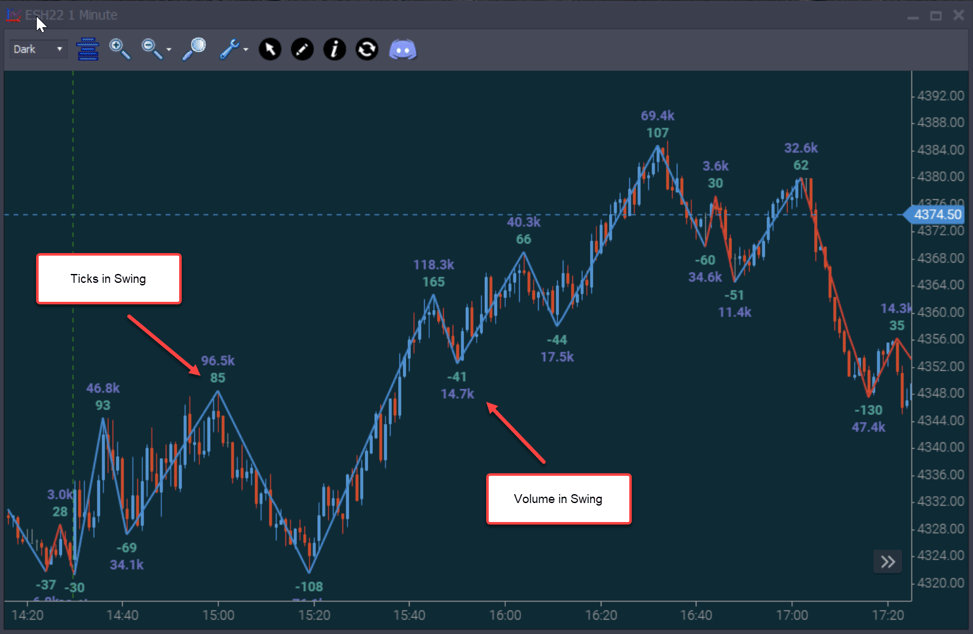
Image 1 – Swing Chart
Most trading platforms have a swing indicator. The above is a 1 min chart of the eMini S&P500 March 2022 contract. The image is from February 28th, 2022. The vertical dotted line on the left indicates the opening of the day session at 9:30 AM EST.
The swings in this case are colored red and blue. We can also see the number of ticks moved in a swing and the total volume in that move.
- Red - A downswing with more volume than the prior upswing OR an upswing with less volume than the prior downswing.
- Blue - An upswing with more volume than the prior downswing OR a downswing with less volume than the prior upswing.
As long as the volume is greater on the moves up, the swings will be blue. Vice versa for reds.
And that’s all we will use. We are not interested in any indicators, in fact, we are not interested in the individual price bars at all. Let’s consider those individual bars the points at which our shoppers are all buying in different places. We are just interested in the turning points, the points at which the fire alarms went off.
As mentioned earlier, I tend to stick to few markets. That means I get to know them well. So I can tell you that the number of contracts in that third blue swing, 118.3 thousand, well, it’s a lot for this market. It’s a lot relative to the other moves on that day and it’s a lot relative to moves on any other day too.
This means a lot of people are jumping on that move. Many of them will be short-term speculators. That means you do NOT want to jump in front of that move and short it. We moved up 164 ticks on 118.3 thousand contracts volume.
With any move, people have to actually close the position in order to exit. On the way down we had selling. Anyone that is short needs to BUY in order to take profits. So as we move down, we are gathering future buyers.
When we see a big surge like this we can conclude that late shorts got stopped out. We can also conclude some shorts took profits and took part in the buying. There are probably some that shorted and didn’t sell yet and are regretting it. So there are people that shorted and lost and others that shorted and took profits. Will, they now short again after this move up? Most likely not in the short term.
New long positions at this point are pretty happy. So if we look at the balance of future trading in the short term, it’s imbalanced to the buy side.
After the initial push up from the lows, we moved back 41 ticks on 14.7 thousand contracts. That’s actually less volume per tick on the way down. That might make you think that this is actually weak because of the relatively small number of contracts for each tick down.
What’s also interesting is that the pullbacks are almost equal size. The first pullback was 41 ticks and the second, was 44 ticks. Bear this in mind because it happens a lot, as we move down we’ll have uniform swing sizes, and then as we move up, we get the same size swings.
We cannot expect the pullbacks to be EXACTLY the same size. In fact, the more volatile the market is, the more variation we can expect in the swing sizes.
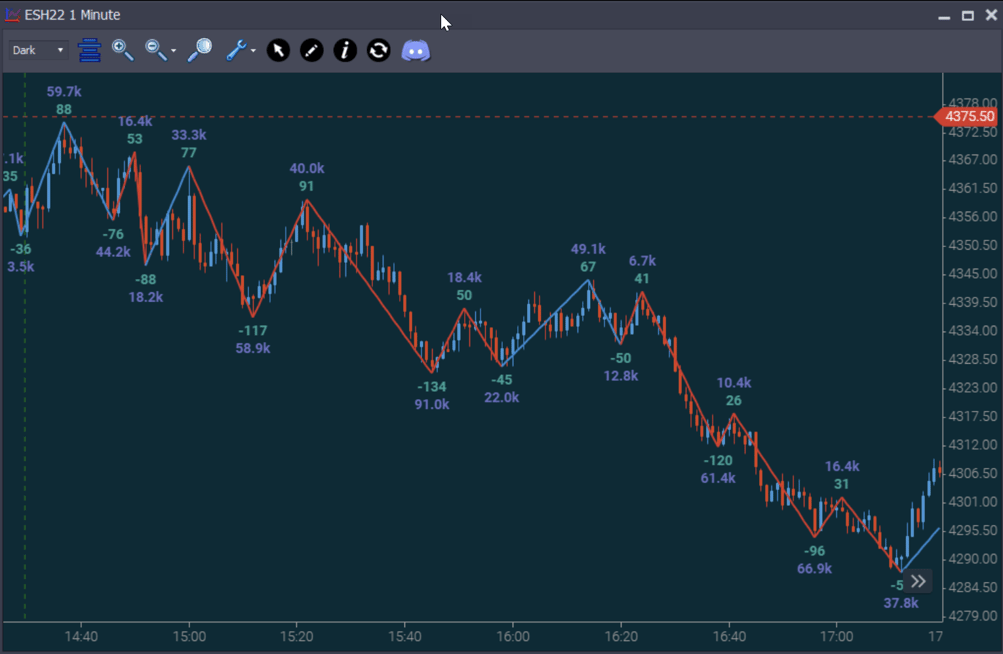
Image 2 – Downswings – March 1st, 2022.
In this image, we can see several ticks variance between the smallest and largest pullbacks on the way down. Compare that to variation to the downside. This is fairly normal.
So for trends, we need to recognize them and we also need to be able to recognize choppier more rangebound markets.
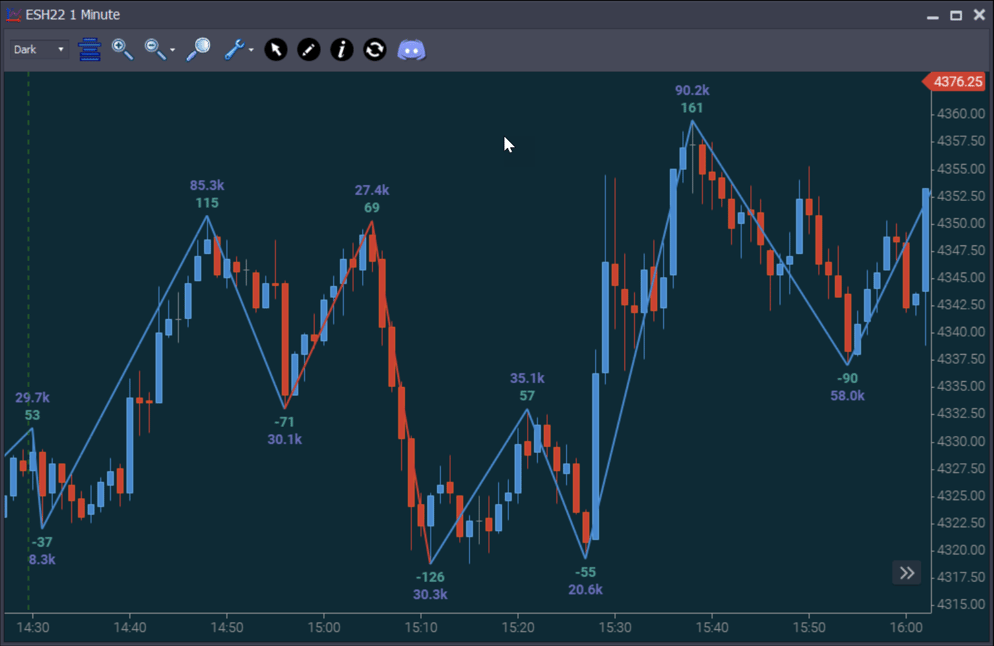
Image 3 – Rangebound start – March 2nd, 2022
We can see the opening of the market on the left. We give ourselves and our competitors in the market a ‘mental reset’ each day and in this case, that’s 9:30 AM EST. At the open, we first give some time to allow the market to show its hand. We started off with some weak move to the downside and then we had a move up with volume that was decent. 85.3 thousand contracts and 115 ticks. Definitely, a move you could jump on to the long side.
The next push up also had less volume and we only gained a few ticks. We didn’t really make any headway. That’s OK but then the next move down was larger than your ‘average’ pullback and had decent volume. This is indecision. Right from the, open it’s not clear who is in control or which side the volume is on. Buyers did appear to take control with that 85.3k push up but there was no follow-through.
Some ranges are easier to spot than others
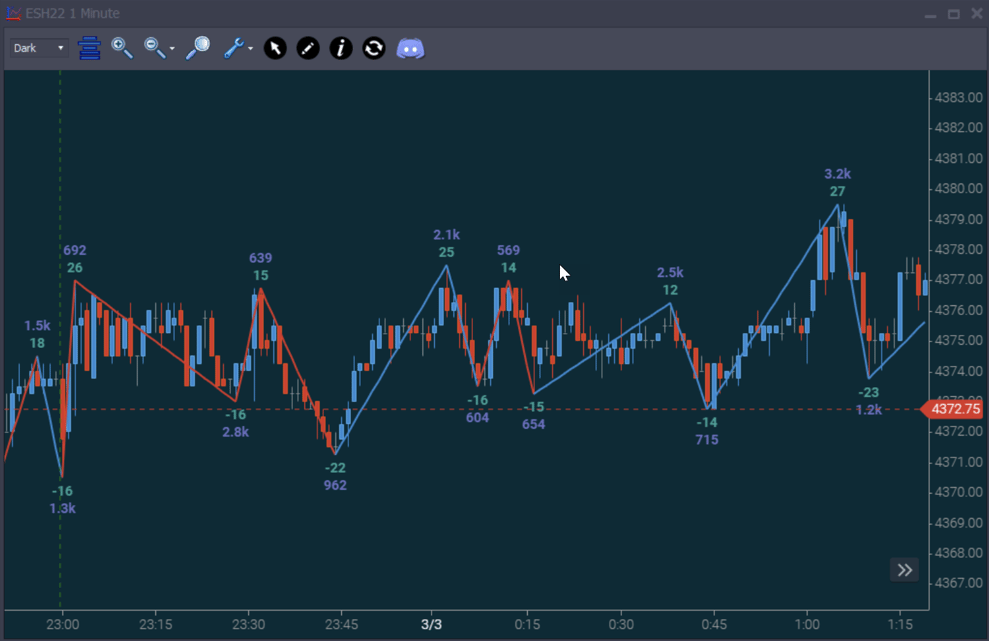
Image 4 – March 3rd, 2022 – Rangebound behavior at overnight open
In this example, we see a very indecisive market, right from the open. Swinging this way and that way with no real clarity regarding which side the volume OR swing size is on. In this example, it’s also fairly clear where you could fade the trading range. It is also clear how attempting to trade pullbacks in the market would be destructive to your account.
The Rules
Putting this together requires you to know your market. That’s simple enough in itself because you can go back over historical charts, look at the swing sizes, and what sort of volume tended to move your specific market.
Market Mode
Your first task is to define which mode the market is in. Is the market in a range or is it trending? Is it a range with lower volume moves and no clear advantage on either side? Caution must be taken when ‘with trend’ moves don’t push price forward a significant amount.
Range Plays
Once you have established that the market is in a range, look to use the volume profile for the day to determine where the most volume sits within the range:
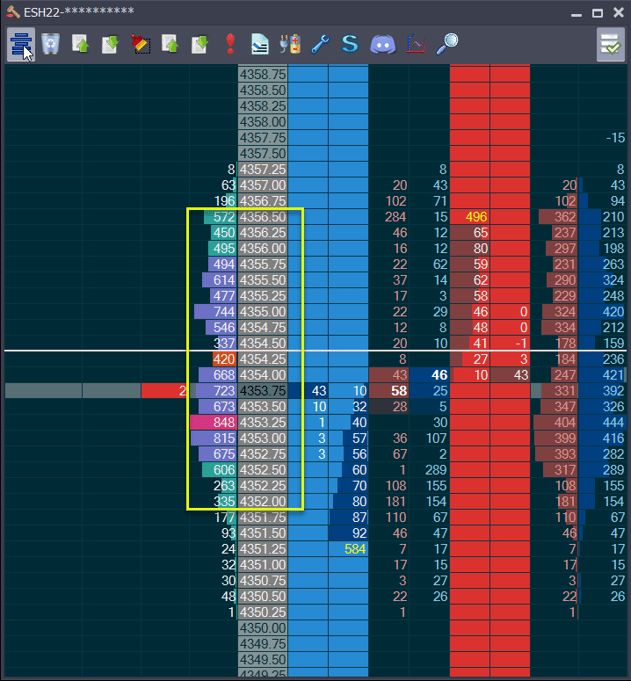
Image 5 – High Volume in an early trading range on March 3rd, 2022
The volume profile (total trades at each price) is the 4th column from the left. As you can see we have volume tapering towards the outside of the range, the high volume area is where the bulk of the positions are (the yellow box). In this case, the range on the chart will be 4350.25 - 4357.25. Your chances of getting filled on a short trade at 4357.25 are extremely low. Look to enter at the extremes of that high volume area.
Strategies
- If the range forms AFTER an intraday trend, there is a good chance price will continue that trend. So if the market moves down and consolidates, you can sell the top of the range and scale off some of the position at the bottom of the range and hold the rest for a breakdown.
- Fade both extremes of the range. This is one of the main ‘bread and butter’ trades for scalpers. It’s moving in and out of the market fairly quickly.
Ranges do not last forever, so it’s essential to exit these range trades quickly if it appears the range is failing. Order Flow will help to keep you onside with ranges but I would advise also using Order Flow to pre-empt the range failing against you. It is imperative that you exit the market before the other range traders get stopped out. If you don’t, you get caught on the wrong side of a stop run and that can put you in ‘catch up’ mode for the rest of the day.
Intraday Trend Plays
Many traders want to buy the low of the day and sell the high of the day. Good luck if you can do that. If the market is range-bound, then of course it is the correct strategy. Intraday trends continue much more often than they reverse. Many traders will see a market trend up and then start looking for a shorting opportunity, then as soon as it starts trending down they start looking for a long opportunity; always getting stuck on the wrong side of the market.
At Jigsaw, we call these people ‘permafaders’.
To avoid being a permafader, set a bias and stick with it until you get evidence the market has shifted in the opposite direction.
Setting Your Bias
When the market opens, look for a strong swing with good volume. If you don’t get it, wait for it OR for a range to develop. If a range develops, look for the breakout with good volume to initiate the trend.
Once an intraday trend is established, the next trend will usually establish itself with a countertrend swing with overwhelming volume and a relatively large swing size in the opposite direction. Once you have one of these, presume a new trend until proven otherwise. Don’t worry if the market didn’t pullback yet or if it pulled back 20 times, stay with that trend until you get the volume/size in the opposite direction.
Trend Plays
Once you have your bias, you look for a weak move in the opposite direction, a pullback. It will be low in volume and relatively small. From an Order Flow perspective, there will be little interest, low participation. Often an iceberg order will stop the pullback and often the countertrend traders will simply disappear.
All markets are different but the eMini S&P500 will often put in 3-5 tradable intraday trends. The second trend will often have the same size pullbacks as the first trend. So you may see the first intraday trend put in 11-14 tick pullbacks and see the same thing as it moves in the opposite direction. That is not magic, just a measure of volatility.
Strategies
- If the average pullback was 10 ticks, look to fade that pullback before the 10 ticks. If the market puts in a 10 tick pullback, it may only trade 100 or so contracts at the 10th tick and you may be right about the location but you will not get filled on a limit order entry. So enter a tick or 2 ahead of it.
- Wait for some ‘with trend’ interest. So instead of entering ahead of the estimated pullback, wait for some ‘with trend’ traders to move the market your way a few ticks. This gives you additional confirmation that the pullback is over but you do have to be quick, it may start to move quickly with the trend when the permafaders realize they are going to get stopped out.
I utilize order flow to tell me when a pullback has ended. This is worth looking into and will yield extra ticks but is not absolutely essential from the start. Get the overall method right first. Then refine it with order flow.
In terms of exiting a losing trade, as soon as you see evidence of decent volume coming in or the pullback has put in an abnormal number of ticks move, it’s time to get out. It’s actually in this area where the Order Flow will help the most because you will SEE the traders coming in to push against the trend. You can often get out before the price has been adversely impacted by that Order Flow.
Conclusion
Using swing charts will put you on the right side of the market and give you a heads up as the market shifts from trending to consolidating. This is a discretionary trading method but the number of components you are using to make the trading decision is small. There is no ‘analysis paralysis’ here. You are trading based on market participation and your knowledge of how speculative traders operate; after all, YOU are a speculative trader.
These methods can also be added to your existing trading techniques, implementing what we have taught about swing sizes and participation in turns, you can use these techniques to help keep you onside within your existing trading framework.