I've been getting a lot of requests about how I set up 2 of the charts I show in Jigsaw Webinars.
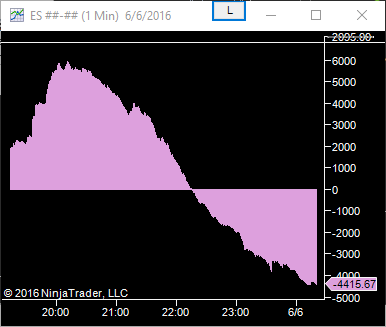
CSI (Cumulative Sheep Index) aka Relative Volume
This shows volume at the time of day relative to the prior n days. In my case, I look back 60 days. In the above image, we can see that we are now 4415 contracts below the 60 day average for the time of day. This is very useful in terms of identifying when volume is picking up or slowing down. The absolute value is not as important as whether it is rising or falling. As participation changes, the price action changes too. In my opinion, this is one of the best ways to analyze volume/participation in the markets.

Average TICK (TICK Tamer)
This is based on the NYSE Tick, which in turn is based on how many of the stocks on the NYSE are ticking up vs down. It's really just a way to look at what the overall stock market is doing.
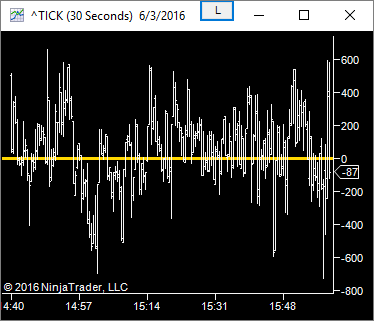
The TICK looks like this:

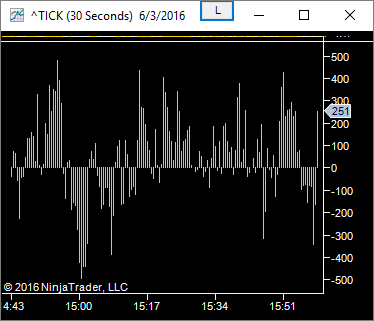
It's not the easiest thing to read, hence needing to tame it and that is what the TICK Tamer does. It takes an average of the values for each bar (there's no lag as it doesn't use history) and that results in either a positive or negative value. Positive values mean overall stocks are ticking up and negative that they are ticking down:

There's no ambiguity when you take an average of the TICK. So it's easy to eyeball whether the day is mixed or one sided. If you are long and it starts taking a massive spike down, your trade may be in peril.
The indicator code for NinjaTrader 7 is attached. If someone has the time to produce these for other platforms and you want to share them, let me know.
Note that I am sharing these here but please do not share them on line without asking first.
Indicators - Manual Install
Download the files to (My) Documents\NinjaTrader 7\bin\Custom\Indicator Then restart Ninja. The indicator names are DTAverageTickIndex and JTRelativeVolume
Indicators - NinjaTrader export file (Use NinjaTrader import to install)
Jigsaw Indicators - Import File
Chart Templates (move to documents\NinjaTrader 7\templates\Chart)
Relative Volume Chart Template

