
Trade Management is very much an overlooked aspect in the art of trading. Many retail traders are so focused on getting the trade entry right that they pay little attention to making sure they get the most from the trade or do their most to avoid losses in a losing trade. On the other hand, many professional traders will tell you that closing losing trades is one of the most important elements of their strategy. With the right trade management techniques, traders can expect tangible benefits in their trading within weeks.
In this article, we will focus on using Order Flow in Trade Management. In fact, using Order Flow in Trade Management is perhaps the simplest, most effective of all techniques for the Order Flow novice to apply. Let’s consider the following scenario:
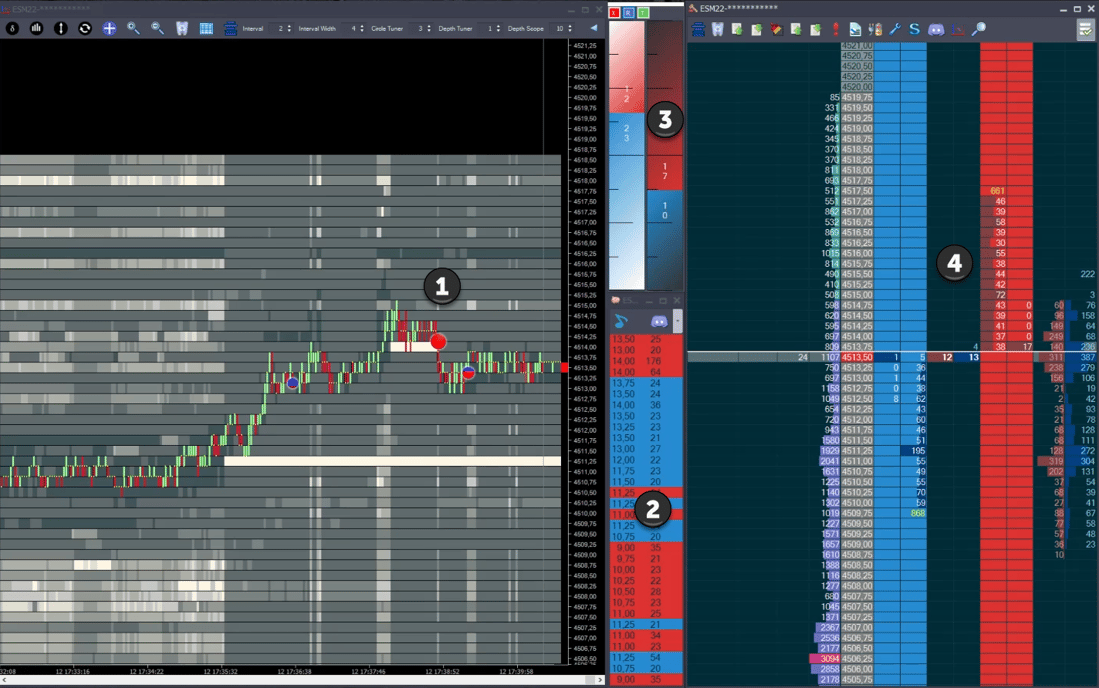
Image 1 - Trading above high buy-side liquidity area
1 – Jigsaw Auction Vista – showing us that we turned down from an area of high volume. We do have high buy-side liquidity below us at 11.25 but we have turned down from point “1” and the move up is failing – we can see that because the market flatlined.
2 – We see the tape, which in this case is now showing just trades of 20 contracts and above. We can see buyers from 13.00-14.00 and it appears these traders are trapped as the market is not able to move up.
3 – The left most power meter is showing the total of buy market orders in blue. It will show sell market orders in red. This reset when we went short.
4 – These center columns show us what is being traded “right here, right now”. It’s current trading activity, if we leave a price and come back to it, these numbers will refresh.
Items 1 & 2 above give us a reason to enter a trade but it’s items 3 & 4 that are key in trade management. These components reset when we enter a trade and are now showing us just the trading activity since we entered the trade.
So what?
Here is the key to improving your trade management. Most traders will manage a trade based on whether price moved against them or not. Traders using order flow can also look at whether the order flow supports that move. For example….
- Price moves against you but order flow does not support that move – risk is still low. This is likely just a ‘wiggle’ in the price.
- Price moves against you and order flow is strong against you too – very high risk of trade failure.
- Price moves your way but order flow is weak – be ready for a move against you, your trade is still not in the clear.
- Price moves your way and order flow is strong – you have a high probability of the trade working out.
- Order flow moves your way but the price doesn’t – high risk – traders in your direction are getting trapped. Time is not on your side & there could be a rapid move against you when the trapped traders exit their trades.
You don’t panic if price moves against without supporting order flow. On the other hand, if the order flow supports a move against you – it doesn’t make a lot of sense to hold onto the trade. Much better to exit before it hits your stop and save a few ticks.
Let’s go back to our example:
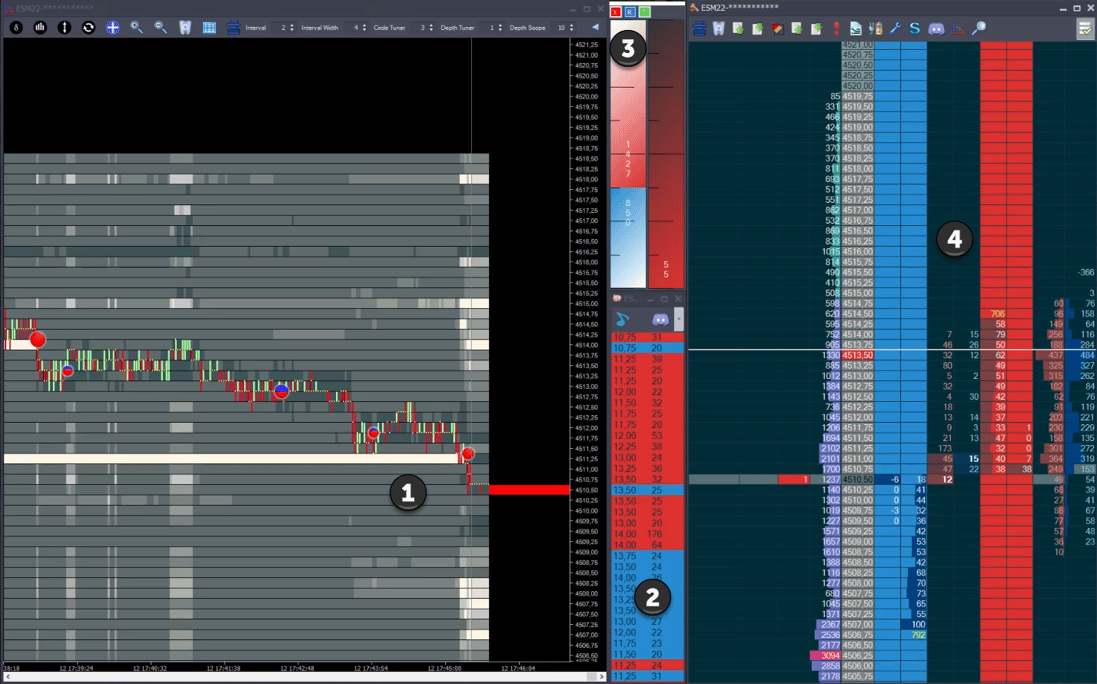
Image 2 - Hit the area of high buy-side liquidity
1 – We can see that price has moved down from where the buyers got stuck. We have now hit the area of high buy-side liquidity at 11.25 (the white line) and we can also see a large trade circle indicating that buyers are absorbing the selling.
2 – We see large sell market orders on the way down. Some will be stops of the trapped buyers above and some will be new shorts initiating.
3 – The strength meter shows 1427 sell market orders compared to 850 buy market orders. Remember, this is just activity since we entered our position. A clear imbalance on the sell-side.
4 – The current trades column shows much more activity on the sell side compared to the buy-side. Of course, we do also see signs that the sellers are getting stuck at the bottom.
Overall, the picture is one of the sellers overwhelming the buyers. We had a good trade location with the buyers trapped and we then had both price AND order flow absolutely in our favor.
Let’s imagine you’d gone long 13.50 and you normally had a fixed 20 tick stop loss. Would there really be any reason to sit through all of that heavy trade against you? It doesn’t make a lot of sense, does it? Even if you sat through all of that activity, you could still get out of the trade right now with a 10 tick loss instead of a 20 tick loss. That’s reducing your loss by 50%. Now imagine an average 50% decrease in your losses across the board and you’ll start to get an appreciation for just how powerful using Order Flow in Trade Management is.
Let’s take a look at another example:
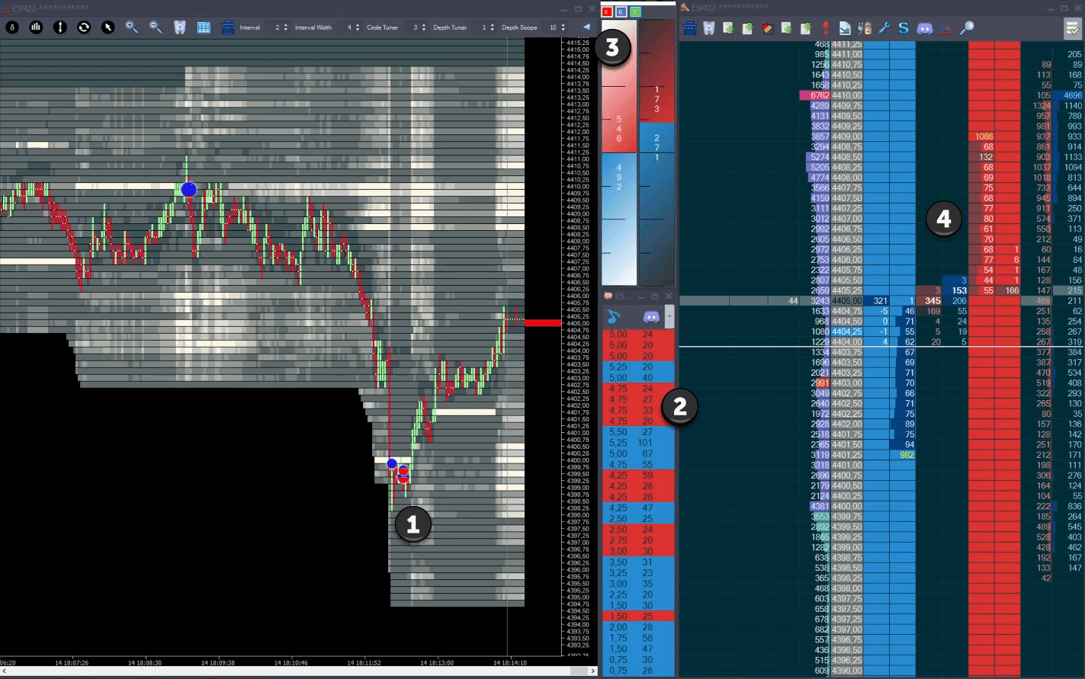
Image 3 - Reverse to the upside
1 – We can see that the market pushed down and once again we saw an area of high volume trading followed by a move up – indicating a possible turning point in the market. We went long at 04.25
2 – We can see that in terms of large traders, the market is fairly balanced. There’s no overwhelming imbalance to one side or the other.
3 – We can see that trading is balanced in terms of total number of contracts traded since we entered. There are just 54 more buy market orders than sell market orders.
4 – We can see that while prices have moved higher, there’s no high imbalance.
Conclusion: Price has moved in our favor but there’s no strength in the move as the order flow is not that strong. In terms of trade management, we can consider paying attention to this trade to see how it plays out.
As we move forward:
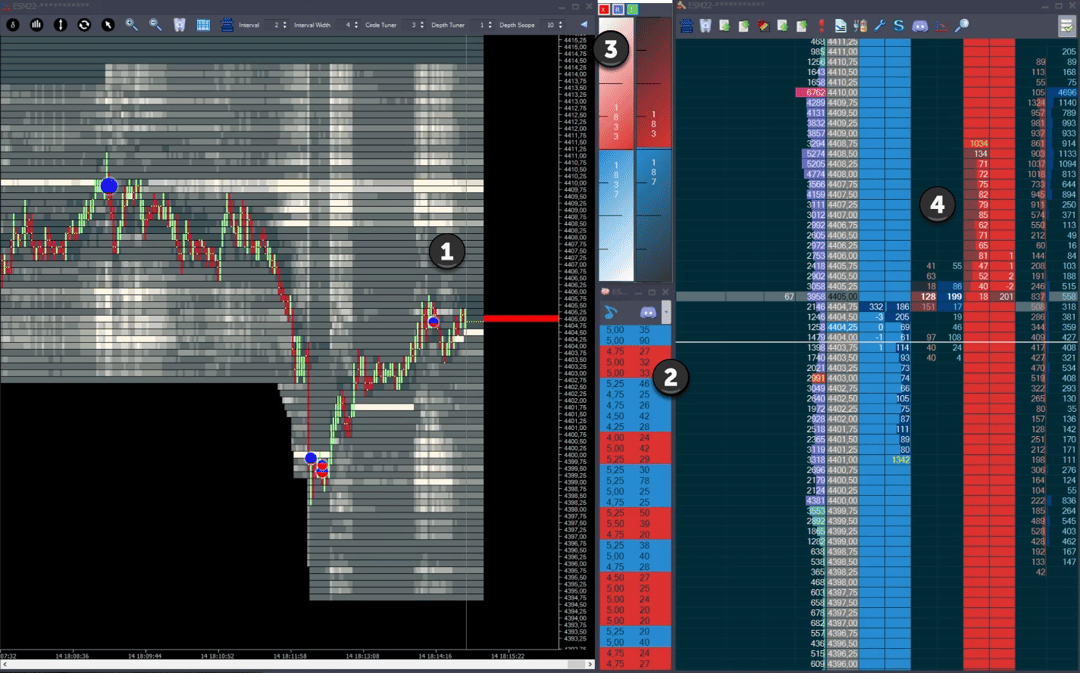
Image 4 - We are trying to break higher
1 - Price moves up. All is fine price-wise.
2 – In terms of large traders, the market is fairly balanced, start to show more sellers
3 – We continue to see the market is fairly balanced.
4 – We can see 199 buys into 05.00, after we dropped back down from 05.75.
Conclusion: Proceed with extreme caution. We have large buyers all the way up to 05.00 and the later ones are now potentially trapped. If the market starts to step down, these buyers will bailout.
Let’s look at what happened:
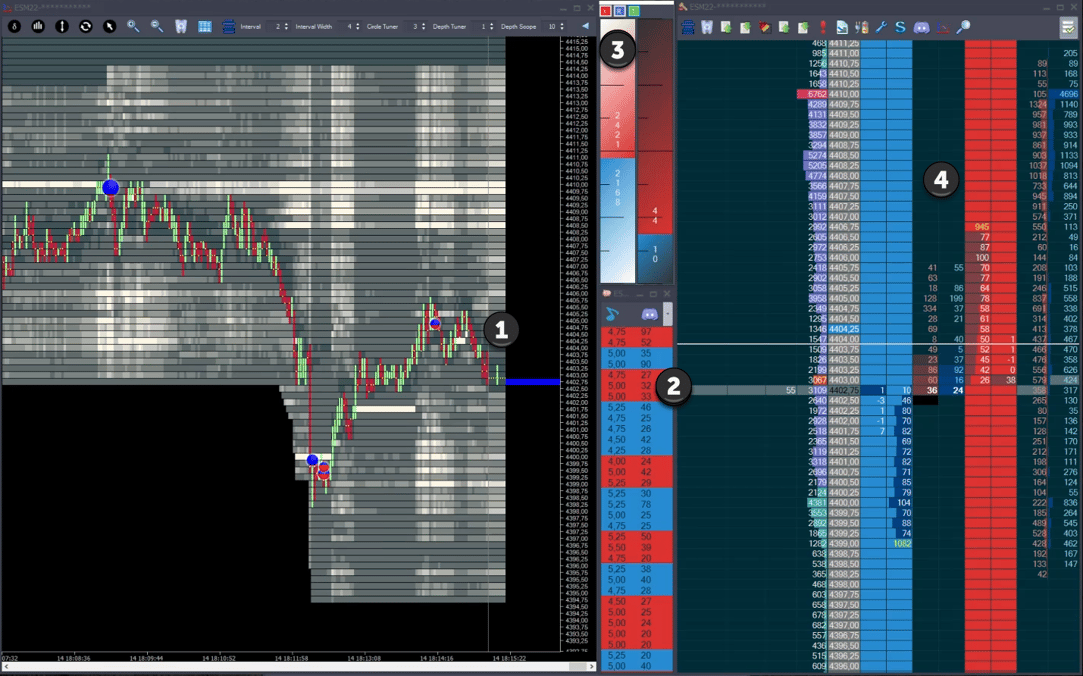
Image 5 - Price move against us
1 – Price has now moved against us. Not good, especially as we had buyers trapped above.
2 – We start to see more sellers stepping in.
3 – Sellers start to overwhelm buyers.
4 – We can see a decent amount of trade on the sell-side.
Conclusion: This is not going our way. Momentum is clearly now to the downside. We can take a loss here and not wait for our stop loss to get hit.
If you didn’t do that, if you’d stayed in, fingers crossed hoping and praying that it would turn around, you would have been disappointed:
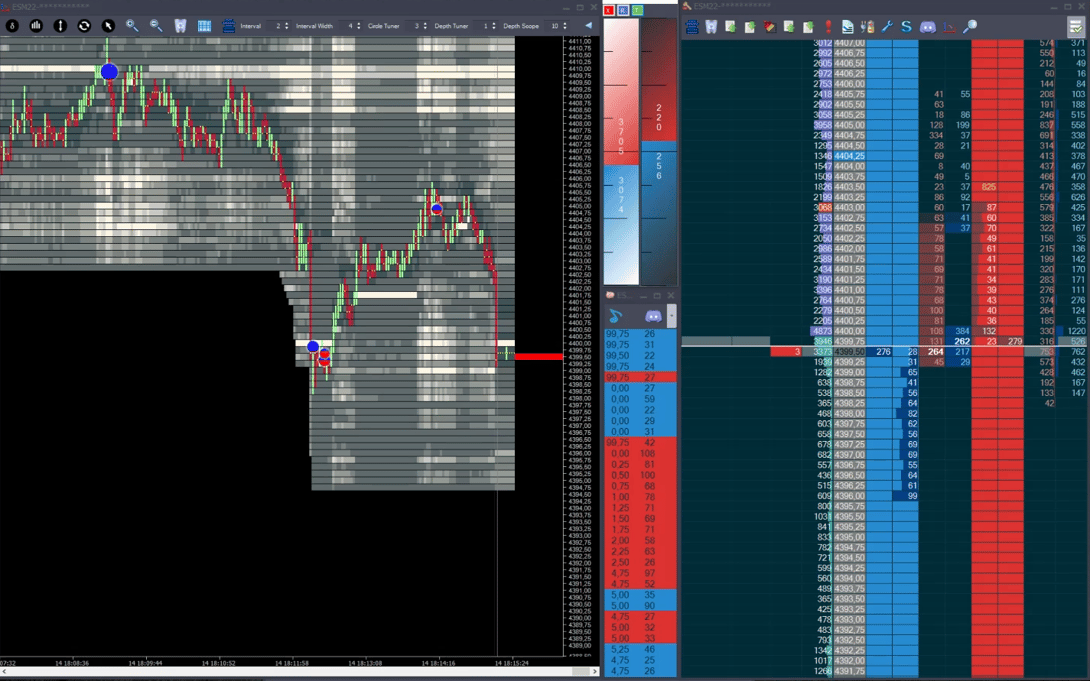
Image 6 - Prices sweep down
Wrapping up
Trade Management with order flow is one of the easiest aspects of order flow to master. That’s because we are looking for overwhelming trade on one side. It’s fairly clear when that occurs. It’s not as nuanced as other aspects of order flow. In the few examples we discussed here, we could have turned a 20 tick stop into a 10 and a 5 tick stop respectively. Trading profitably isn’t all about “where to get in”. Drastically reducing your losses will make a huge impact on your profits too.